torcheeg.utils
plot_raw_topomap
- torcheeg.utils.plot_raw_topomap(tensor: ~torch.Tensor, channel_list: ~typing.List[str], sampling_rate: int, plot_second_list: ~typing.List[int] = [0.0, 0.25, 0.5, 0.75], montage: ~mne.channels.montage.DigMontage = <DigMontage | 0 extras (headshape), 0 HPIs, 3 fiducials, 94 channels>)[source][source]
Plot a topographic map of the input raw EEG signal as image.
from torcheeg.utils import plot_raw_topomap
from torcheeg.constants import DEAP_CHANNEL_LIST

eeg = torch.randn(32, 128)
img = plot_raw_topomap(eeg,
                 channel_list=DEAP_CHANNEL_LIST,
                 sampling_rate=128)
# If using jupyter, the output image will be drawn on notebooks.

- Parameters:
tensor (torch.Tensor) – The input EEG signal, the shape should be [number of channels, number of data points].
channel_list (list) – The channel name lists corresponding to the input EEG signal. If the dataset in TorchEEG is used, please refer to the CHANNEL_LIST related constants in the
torcheeg.constantsmodule.sampling_rate (int) – Sample rate of the data.
plot_second_list (list) – The time (second) at which the topographic map is drawn. (default:
[0.0, 0.25, 0.5, 0.75])montage (any) – Channel positions and digitization points defined in obj:mne. (default:
mne.channels.make_standard_montage('standard_1020'))
- Returns:
The output image in the form of
np.ndarray.- Return type:
np.ndarray
plot_feature_topomap
- torcheeg.utils.plot_feature_topomap(tensor: ~torch.Tensor, channel_list: ~typing.List[str], feature_list: ~typing.List[str] | None = None, montage: ~mne.channels.montage.DigMontage = <DigMontage | 0 extras (headshape), 0 HPIs, 3 fiducials, 94 channels>, fig_shape: ~typing.Tuple[int, int] | None = None)[source][source]
Plot a topographic map of the input EEG features as image.
from torcheeg.utils import plot_feature_topomap
from torcheeg.constants import DEAP_CHANNEL_LIST

eeg = torch.randn(32, 4)
img = plot_feature_topomap(eeg,
                 channel_list=DEAP_CHANNEL_LIST,
                 feature_list=["theta", "alpha", "beta", "gamma"])
# If using jupyter, the output image will be drawn on notebooks.

- Parameters:
tensor (torch.Tensor) – The input EEG signal, the shape should be [number of channels, dimensions of features].
channel_list (list) – The channel name lists corresponding to the input EEG signal. If the dataset in TorchEEG is used, please refer to the CHANNEL_LIST related constants in the
torcheeg.constantsmodule.feature_list (list) – . The names of feature dimensions displayed on the output image, whose length should be consistent with the dimensions of features. If set to None, the dimension index of the feature is used instead. (default:
None)montage (any) – Channel positions and digitization points defined in obj:mne. (default:
mne.channels.make_standard_montage('standard_1020'))fig_shape (Tuple[int, int], optional) – The shape of the sub graphs (width, height). If None, the layout is automatically set to (1, len(feature_list)). (default:
None)
- Returns:
The output image in the form of
np.ndarray.- Return type:
np.ndarray
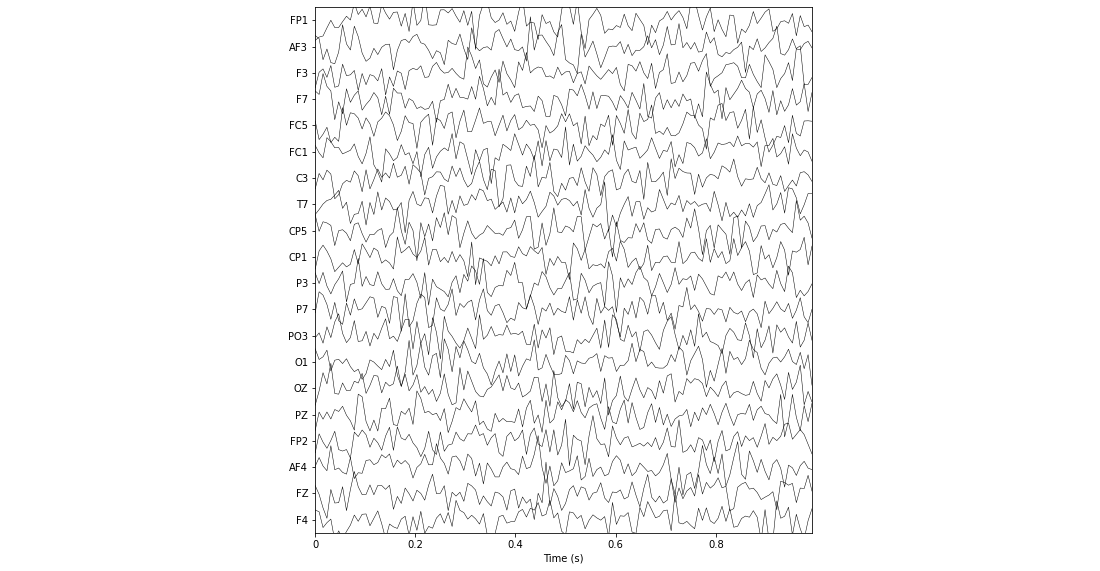
plot_signal
- torcheeg.utils.plot_signal(tensor: ~torch.Tensor, channel_list: ~typing.List[str], sampling_rate: int, montage: ~mne.channels.montage.DigMontage = <DigMontage | 0 extras (headshape), 0 HPIs, 3 fiducials, 94 channels>)[source][source]
Plot signal values of the input raw EEG as image.
import torch

from torcheeg.utils import plot_signal
from torcheeg.constants import DEAP_CHANNEL_LIST

eeg = torch.randn(32, 128)
img = plot_signal(eeg,
                  channel_list=DEAP_CHANNEL_LIST,
                  sampling_rate=128)
# If using jupyter, the output image will be drawn on notebooks.
- Parameters:
tensor (torch.Tensor) – The input EEG signal, the shape should be [number of channels, number of data points].
channel_list (list) – The channel name lists corresponding to the input EEG signal. If the dataset in TorchEEG is used, please refer to the CHANNEL_LIST related constants in the
torcheeg.constantsmodule.sampling_rate (int) – Sample rate of the data.
montage (any) – Channel positions and digitization points defined in obj:mne. (default:
mne.channels.make_standard_montage('standard_1020'))
- Returns:
The output image in the form of
np.ndarray.- Return type:
np.ndarray
plot_3d_tensor
- torcheeg.utils.plot_3d_tensor(tensor: Tensor, color: Colormap | str = 'hsv')[source][source]
Visualize a 3-D matrices in 3-D space.
from torcheeg.utils import plot_3d_tensor

eeg = torch.randn(128, 9, 9)
img = plot_3d_tensor(eeg)
# If using jupyter, the output image will be drawn on notebooks.

- Parameters:
tensor (torch.Tensor) – The input 3-D tensor.
color (colors.Colormap or str) – The color map used for the face color of the axes. (default:
hsv)
- Returns:
The output image in the form of
np.ndarray.- Return type:
np.ndarray
plot_2d_tensor
- torcheeg.utils.plot_2d_tensor(tensor: Tensor, color: Colormap | str = 'hsv')[source][source]
Visualize a 2-D matrices in 2-D space.
import torch

from torcheeg.utils import plot_2d_tensor

eeg = torch.randn(9, 9)
img = plot_2d_tensor(eeg)
# If using jupyter, the output image will be drawn on notebooks.

- Parameters:
tensor (torch.Tensor) – The input 2-D tensor.
color (colors.Colormap or str) – The color map used for the face color of the axes. (default:
hsv)
- Returns:
The output image in the form of
np.ndarray.- Return type:
np.ndarray
plot_adj_connectivity
- torcheeg.utils.plot_adj_connectivity(adj: Tensor, channel_list: list | None = None, region_list: list | None = None, num_connectivity: int = 60, linewidth: float = 1.5)[source][source]
Visualize connectivity between nodes in an adjacency matrix, using circular networks.
import torch

from torcheeg.utils import plot_adj_connectivity
from torcheeg.constants import SEED_CHANNEL_LIST

adj = torch.randn(62, 62) # relationship between 62 electrodes
img = plot_adj_connectivity(adj, SEED_CHANNEL_LIST)
# If using jupyter, the output image will be drawn on notebooks.

- Parameters:
adj (torch.Tensor) – The input 2-D adjacency tensor.
channel_list (list) – The electrode name of the row/column in the input adjacency matrix, used to label the electrode corresponding to the node on circular networks. If set to None, the electrode’s index is used. (default:
None)region_list (list) – region_list (list): The region list where the electrodes are divided into different brain regions. If set, electrodes in the same area will be aligned on the map and filled with the same color. (default:
None)num_connectivity (int) – The number of connections to retain on circular networks, where edges with larger weights in the adjacency matrix will be limitedly retained, and the excess is omitted. (default:
50)linewidth (float) – Line width to use for connections. (default:
1.5)
- Returns:
The output image in the form of
np.ndarray.- Return type:
np.ndarray
plot_graph
- torcheeg.utils.plot_graph(data: pyg.data.Data, channel_location_dict: Dict[str, List[int]], color: Colormap | str = 'hsv')[source][source]
Visualize a graph structure. For the electrode position information, please refer to constants grouped by dataset:
datasets.constants.emotion_recognition.deap.DEAP_CHANNEL_LOCATION_DICT
datasets.constants.emotion_recognition.dreamer.DREAMER_CHANNEL_LOCATION_DICT
datasets.constants.emotion_recognition.seed.SEED_CHANNEL_LOCATION_DICT
…
from torcheeg.utils.pyg import plot_graph
from torcheeg.datasets.constants import DEAP_CHANNEL_LOCATION_DICT
from torcheeg.transforms.pyg import ToG
import numpy as np

eeg = np.random.randn(32, 128)
g = ToG(DEAP_ADJACENCY_MATRIX)(eeg=eeg)['eeg']
img = plot_graph(g)
# If using jupyter, the output image will be drawn on notebooks.

- Parameters:
data (torch_geometric.data.Data) – The input graph structure represented by torch_geometric.
channel_location_dict (dict) – Electrode location information. Represented in dictionary form, where
keycorresponds to the electrode name andvaluecorresponds to the row index and column index of the electrode on the grid.color (colors.Colormap or str) – The color map used for the face color of the axes. (default:
hsv)
- Returns:
The output image in the form of
np.ndarray.- Return type:
np.ndarray
